In private markets, where startups are not obligated to share their results publicly – or, more likely, are too early in their lifecycle to really even know what results they’re experiencing – it is often very difficult to figure out which startup is doing better than another. Intuitively, many people (us included!) take the information that is available and try to make sense of it. And the information often available at hand is a startup's fundraising history.
And most people (us included, again) tend to look at a startup’s fundraising history and try to extract insights from it. How much capital has this company raised? Have they raised more at a given round than we might expect? Have they raised rounds of funding at a faster rate? Are they raising money from selective investors? Investors who have historically backed successful companies?
We have attempted to quantify these variables, and the focus of this post is on our Investor Signal Score, which focuses on those last two questions: Are startups raising money from selective investors? Are these investors who have historically backed successful startups?
What can our Investor Signal Score tell us about a startup beyond “it has a good cap table”? At the earlier stages, it can signal a team’s strength – VCs want to back great entrepreneurs, and great entrepreneurs want great VCs backing them. At later stages, it can signal product-market fit and potential traction. Our Investor Signal score can help point you in the right direction for how to prioritize your diligence.
What we did:
Our Investor Signal Score assesses an investor’s historical success weighted based on the risk profile of a specific round, enabling us to score a startup’s cap table.
Our original score primarily weighted firm size, exit prices, and exit rates (the percent of unique investments that went on to exit via an acquisition or IPO). However, there are numerous different types of firms and each of these metrics isn’t always comparable in a vacuum.
First, we decided to weight investors according to the time they got into the round. If a firm exclusively invests in Series F rounds, its investments have a much higher likelihood of exit. However, with Seed firms, there are no guarantees. Here, we weighted the investors by the historical exit rate of each round they participated in.
Second, we weighted investors if they lead the rounds or not. Are these investors making an active and financially larger decision? Lead investors are taking on more “risk” per se and rewarded exactly for that.
Third, and perhaps the most straightforward, we weight investors based on their investments’ overall exit prices.
At the investor level, the score is the sum of its successes. Our Investor Signal Score does not place investors into "good" and "bad" buckets. Simply, the presence of a top-scoring firm indicates that, statistically speaking, for a long time, the firm’s presence has been a strong indicator that the startup is compelling.
Below, we detail our methodology for calculating our Investor Signal Score and ICS.
Methodology
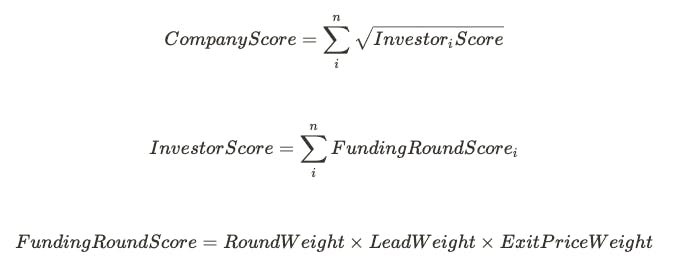
The core unit of the Investor Quality Score is the funding round. The Investor Quality Score is the sum of its funding round scores, which is the product of the relative funding round weight, whether the investor led the round or not, and the ultimate exit price that company exited for. Importantly, the Investor Quality Score only takes into account exited companies. Active investments have a 0 Exit Price Weight.
Let's take Plaid as an example. Spark Capital led its Seed and Series A rounds (NEA co-led the Series A). Kleiner Perkins and Index Ventures led its Series C. It seems counter-intuitive to rank Spark's success on the same level as Kleiner Perkins. As a Seed investor, you’re making an investment based on less information than a Series C investor. Here, for Spark Capital and Kleiner Perkins, the Exit Price Weight and the Lead Weight are the same however they have different Round Weights. The difference, detailed below, between a Seed and Series C investment here is 9x.
Investors often invest in multiple rounds for a company. For the sum, we only take the max round score for a single company. So for Spark, investing in both the Seed and Series A for Plaid, we only take into account the Seed stage score, given it is the larger of the two.
Round Weight

To assess the 'riskiness' of a round, the Round Weight is calculated proportionally to its historical rate of success.
Below are a few examples for the Round Weight constant.
- 7.6% of companies that raised a Seed round went on to exit. Round Weight = 47.3
- 19.9% of companies that raised a Series A round went on to exit. Round Weight = 11.3
- 27.5% of companies that raised a Series B round went on to exit. Round Weight = 6.9
- 33.5% of companies that raised a Series C round went on to exit. Round Weight = 5.2
This analysis rates the Seed stage quite generously, valuing them ~4.2x more than Series A, ~6.9x than Series B, and ~9.1x than Series C rounds.
We raise the Round Exit Rate to the power of 1.5 as a way to exaggerate the difference between rounds. Investors are willing to take a bet on novel ideas in the earlier stages, which is what we're giving value to here. When you're making a Series A bet, you're making the decision based on data, while Seed rounds are less based on data. We should give more credit than just the probability, as Seed rounds are harder to underwrite.
Lead Weight
If an investor is a lead investor for the round, we weight that round 3x. Lead investors take on more risk than their co-investors. We calculate the lead weight by looking at the historical ratio of lead investors to non-leads in their respective rounds.
For rounds after 2000 where a lead existed and was not the only investor, the mean ratio was 0.42 and the median ratio was 0.33. If we take the inverse of this to be the weight, the mean would be a weight of 2.3 and the median would be a weight of 3. For this analysis, we take the median.
Exit Price Weight

This is the home run multiplier. Exits are both IPOs and acquisitions. If a company is active, it's given a score of 0. If the price is undisclosed, it's given a score of 1. The multiplier is calculated as:
A $5.3b exit price turns into a ~73x exit price weight vs. a ~32x multiplier for a $1b exit.
The Top 20 Investors
Below is the list of the top 20 investors by Investor Signal Score! Many of these, unsurprisingly, are household names.
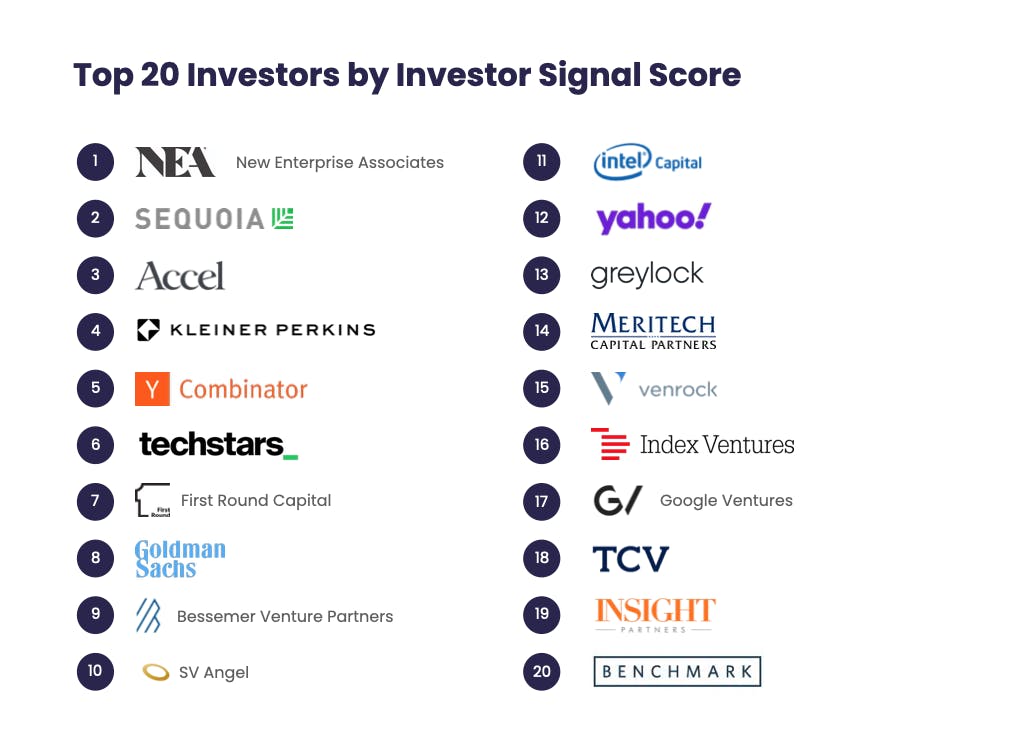
It’s important to remember here that the score does mean that NEA is the greatest firm of all time. The presence of NEA leading a round is a strong indicator that said startup is worth paying attention to. At early stages, the Investor Quality Score can be an easy early indicator that can set it apart from its peers. Having First Round or Y Combinator backing early stage companies likely indicates a great founding team. Having Insight Partners participate in later-stage Series B and C rounds can be a real indicator of traction.
Further Areas of Exploration
Over the next few weeks, we'll be applying this score to the forever changing startup landscape. What have smart investors been doing during these past few months of uncertainty? More importantly, what entrepreneurs have they been backing?
The Investor Signal Score factors into our Radar and Debrief products enabling us to swiftly cut through hundreds of companies to extract those with strong investor backing. When figuring out who to back, who to acquire, who to talk to – the investor signal is an easy starting point for narrowing your search.
If you have any questions regarding the score or curious to learn more, email harry@radicleinsights.com.
–––
Notes
• This analysis was run using Crunchbase data.
• Round exit rates look at funding rounds raised after January 1, 2000.
• Certain rounds with a less robust total are grouped together. These groups are:
Very Early Stage: Pre-seed, Angel Investors
Late Stage: Series F-J, Secondary Market
Certain rounds were removed: Debt Financing, Grant, Post IPO Equity, Post IPO Debt, Post IPO Secondary, Non-Equity Assistance, Initial Coin Offerings, Equity Crowdfunding, Product Crowdfunding