If you look at any TechCrunch article that announces the latest round of funding for the next promising startup, you’ll notice that the amount of capital raised by the company is placed on equal footing with the quality of the investors that are betting on the company. Taking an example from earlier this summer, consider Grammarly’s “$110 million from General Catalyst, IVP, and Spark Capital to take their business to the next level”. Indeed, it’s fairly common to evaluate a startup’s potential based on how much capital it has raised as well as from whom.
If you’re an experienced venture capitalist or well-seasoned startup founder, then thinking about the quality of the capital behind a startup is likely very natural to you. For others, however, this kind of thinking is probably unusual. There is a difference between raising $10 million from one institution to another, not only in the fundraising experience, but also on the end results (we have our own estimates of the probability of success per VC fund, but reference Chamath Palihapitiya’s tweet for social validation).
The idea seems simple enough, but the thought set off some interesting research in Radicle’s data science laboratory — leading to a purely mathematical expression of the signal generated by a startup’s capitalization table.
Essentially, we’ve created an algorithm that confirms what you would otherwise presume. Consider two freshly funded startups, Gamma and Theta. If Gamma is backed by Sequoia Capital, Benchmark, and Accel Partners, and Theta is funded exclusively by Sequoia Capital, then you would intuitively consider that Gamma must be more attractive in some way, even though Sequoia Capital is in both sets. Having the addition of Benchmark and Accel Partners in Gamma’s set gives us more signal. It’s hard to describe, but with Gamma we have the qualitative validation of two additional institutions with lots of capital and huge reputations.
In general, we believe that convincing not just one but multiple mammoth VCs to sponsor an idea is incredibly difficult, and that belief gives us more confidence in a startup that is able to do so. Perhaps it’s because doing so implies that the CEO may be a great strategist, or that the startup has higher than usual product-market fit, or strong early customer traction. We’re not really sure exactly why, but our prior beliefs make us commonly assess a startup’s potential by the quality of its investors. It’s no guarantee of success, of course — venture capital is a game of probabilities — but it nonetheless instills more confidence in us. So much so that it’s an important component of any press release announcing a funding round.
Since it’s so commonplace I figured we should try to measure it, and well—we have—and we’re calling it the Investor Cluster Score™ (ICS). Like most things in Radicle’s data science lab, the ICS originally came about while I was conjuring up additional features for our Startup Anomaly Detection™ algorithm, which estimates the probability that a startup will achieve an exit via an initial public offering or acquisition. As a result, the ICS was designed with the understanding that the majority of information available to investors is noise, and is therefore built with the overall purpose of extracting objectively meaningful signal for predictive purposes.
How it works
Broadly speaking, the Investor Cluster Score™ is calculated by an algorithm that evaluates the information contained in a few distinct signals, including the size of venture capital firms, their level of investment activity, and their maturity relative to peers. Average outcomes are not included in our feature space because, as mentioned above, venture capital is a game of probabilities. We assume that funds that attract more capital have historically been more successful in some way, and hence more prominent in people’s minds (i.e., stronger signal). We start by computing, for all VCs, micro VCs, accelerators, incubators, angel entities, and individuals with at least 50 prior investments, a VC Prominence Score™.
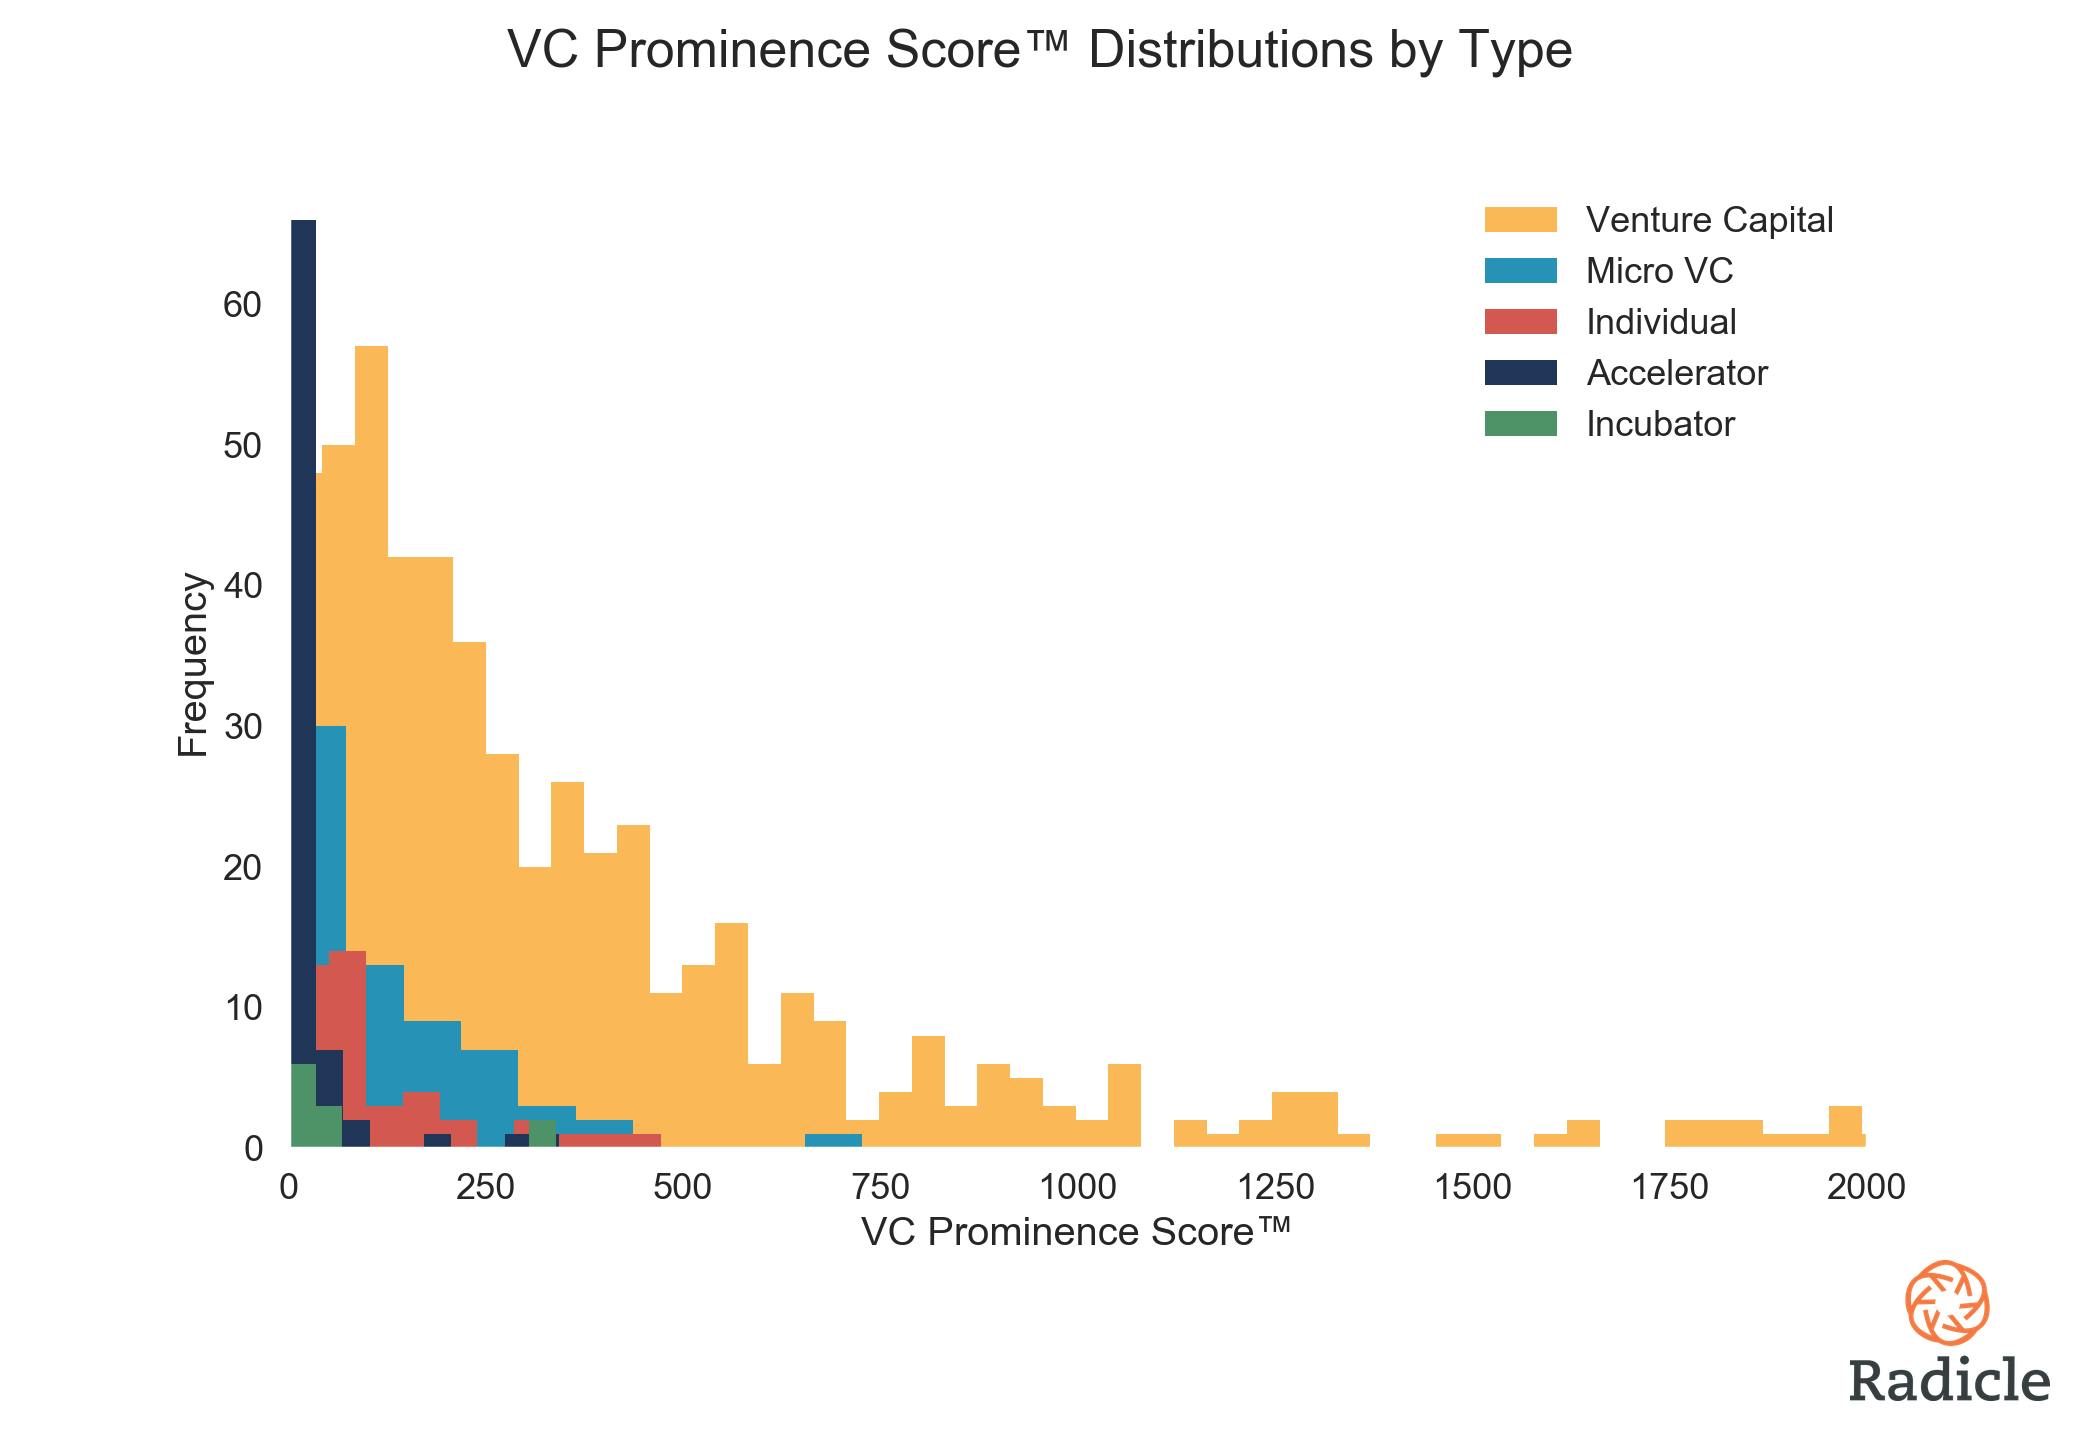
The skewed distribution above suggests that there are only a few dozen venture capital institutions that produce a really strong market signal — your Sequoias of the world. We think that this is an accurate representation of the ground-truth reality because there really aren’t many of them. Also notice how a few accelerators, incubators, and individuals have higher prominence scores than many full-fledged VC entities (think Y Combinator, Techstars, Peter Thiel, Yuri Milner, Fabrice Grinda).
We then compute the Investor Cluster Score™ by aggregating the VC Prominence Score™ of each investor that shows up in a startup’s capitalization table. Doing so is a non-trivial engineering task at the intersection of natural language processing and data analysis, but the end result is a vector that captures the characteristics of the capital behind a startup. The algorithm even accounts for each time a VC doubles down on their belief in a startup (more on this further down).
We’re not releasing the VC Prominence Scores™ at this time, because (1) we’re in the business of analyzing the signal from startups, not ranking investing entities, and perhaps more importantly (2) we don’t actually believe the VC ranking our algorithm produces, nor indeed any specific ranking, could provide the end all be all definitive rank of VCs. In the abstract, some funds are likely better than others in very unique aspects, industries, or stages, and it all really depends on what your end goal really is. Our goal was to create a purely mathematical expression of the information contained in a startup’s capitalization table, and our results are not only intuitive but also useful. In data science, sometimes utility is all that really matters.
Okay so what are the results, and why should I care?
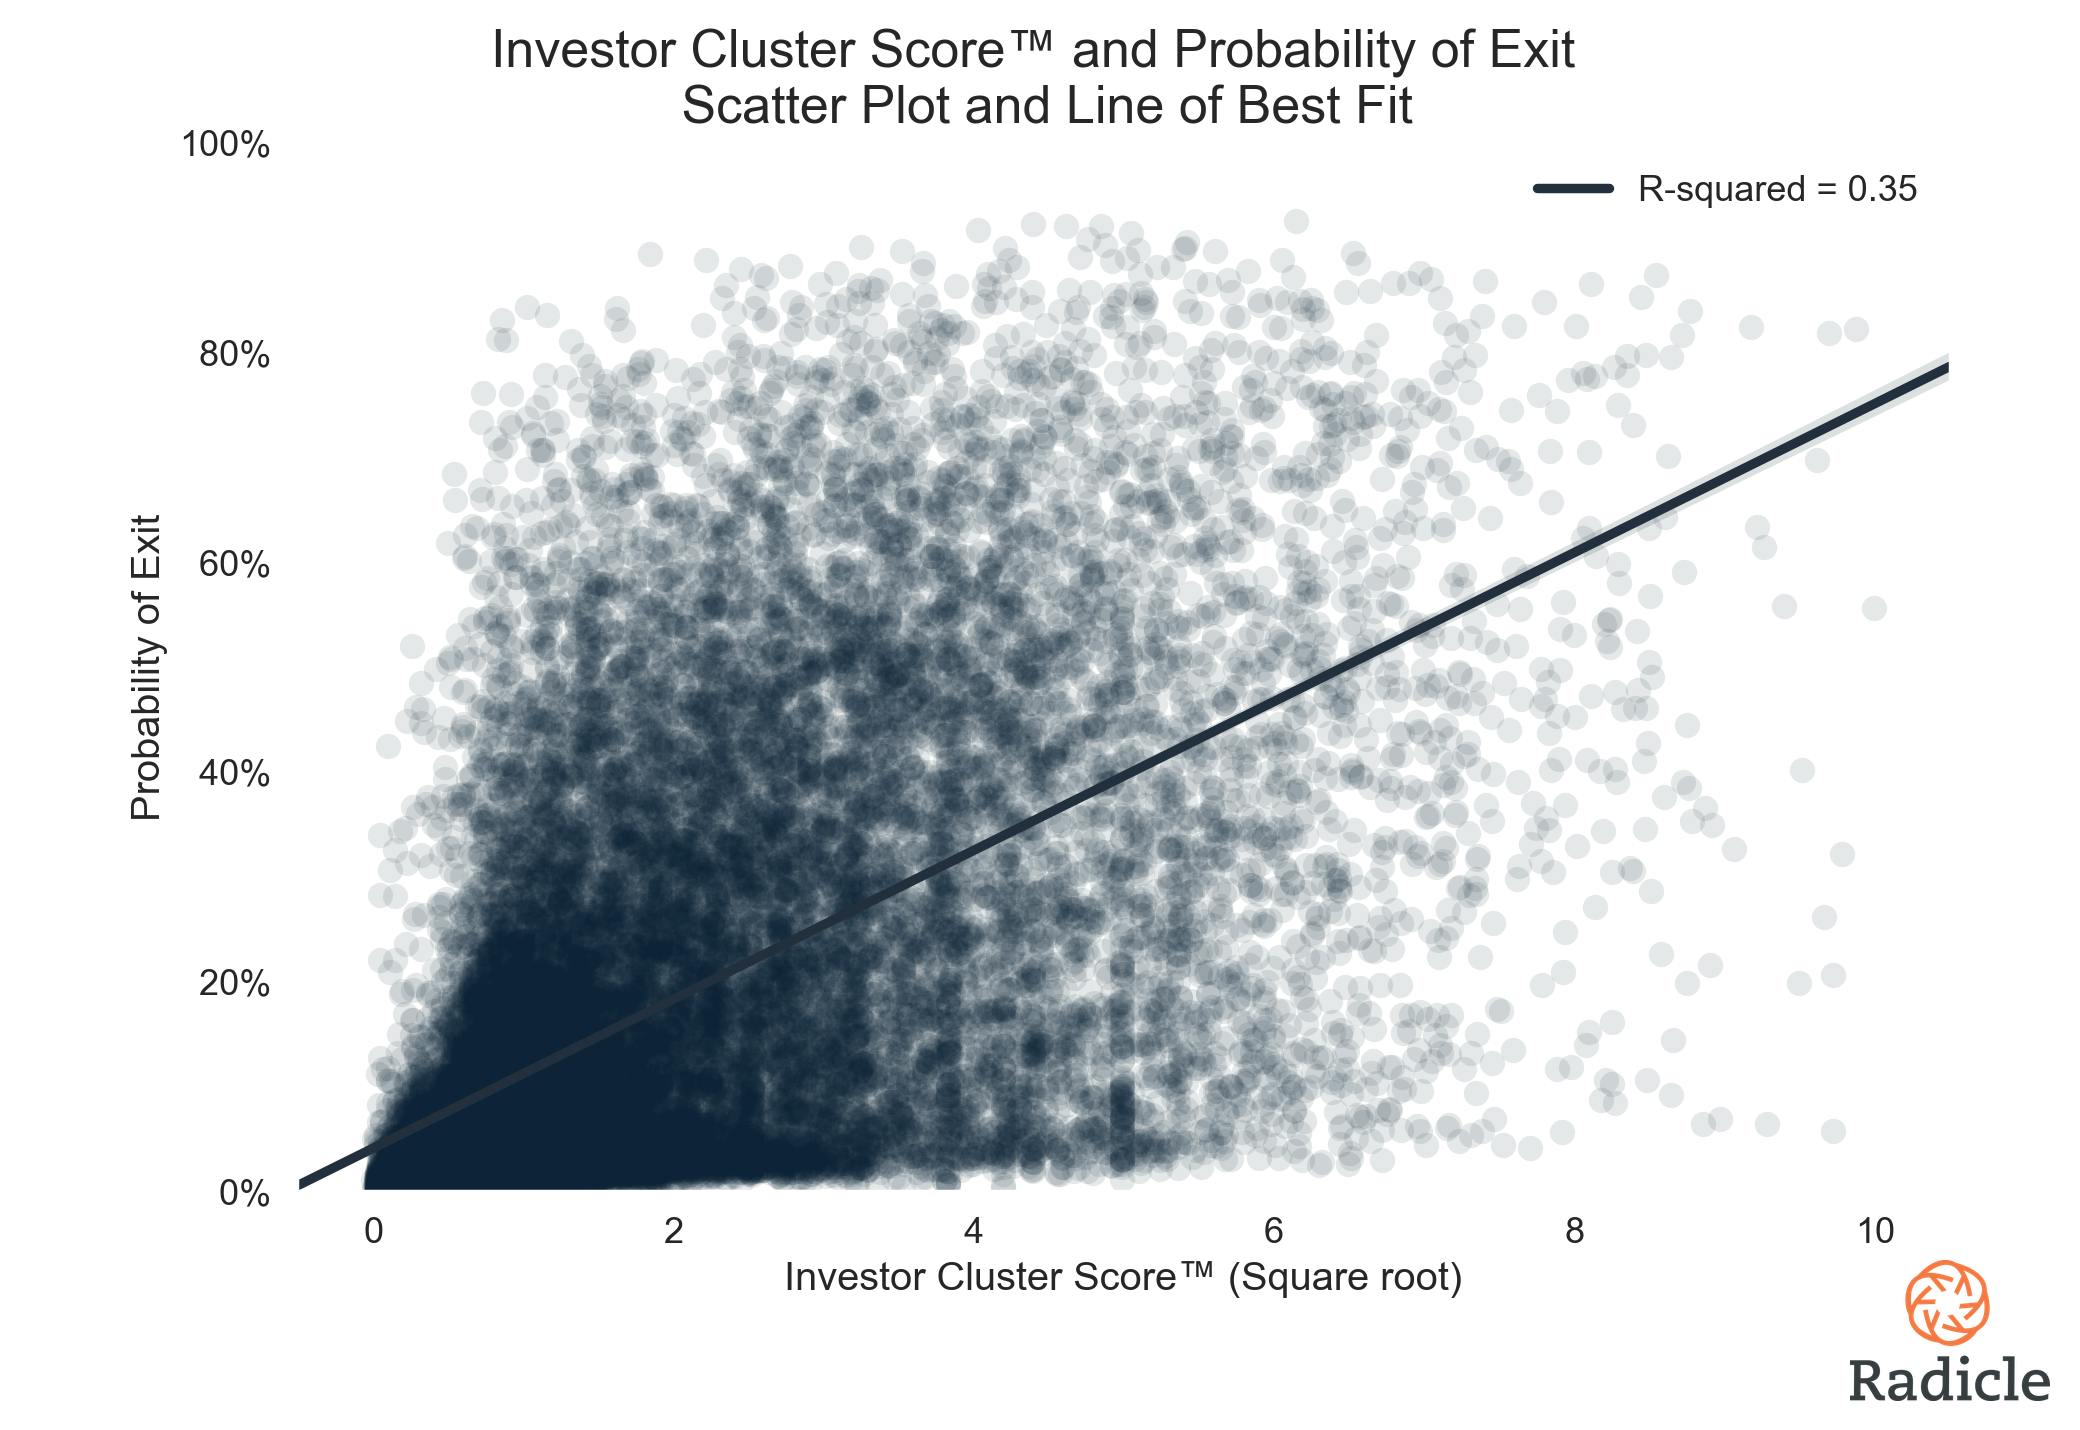
At a very fundamental level, the Investor Cluster Score™ is an interesting metric because it’s indicative of exit potential (high feature importance in data science jargon). That implies that there’s a statistically positive correlation between the signal from a startup’s capitalization table as measured by the ICS (square root normalized) and their probability of exit (OLS regression, p < 0.001, R-squared = 0.35).
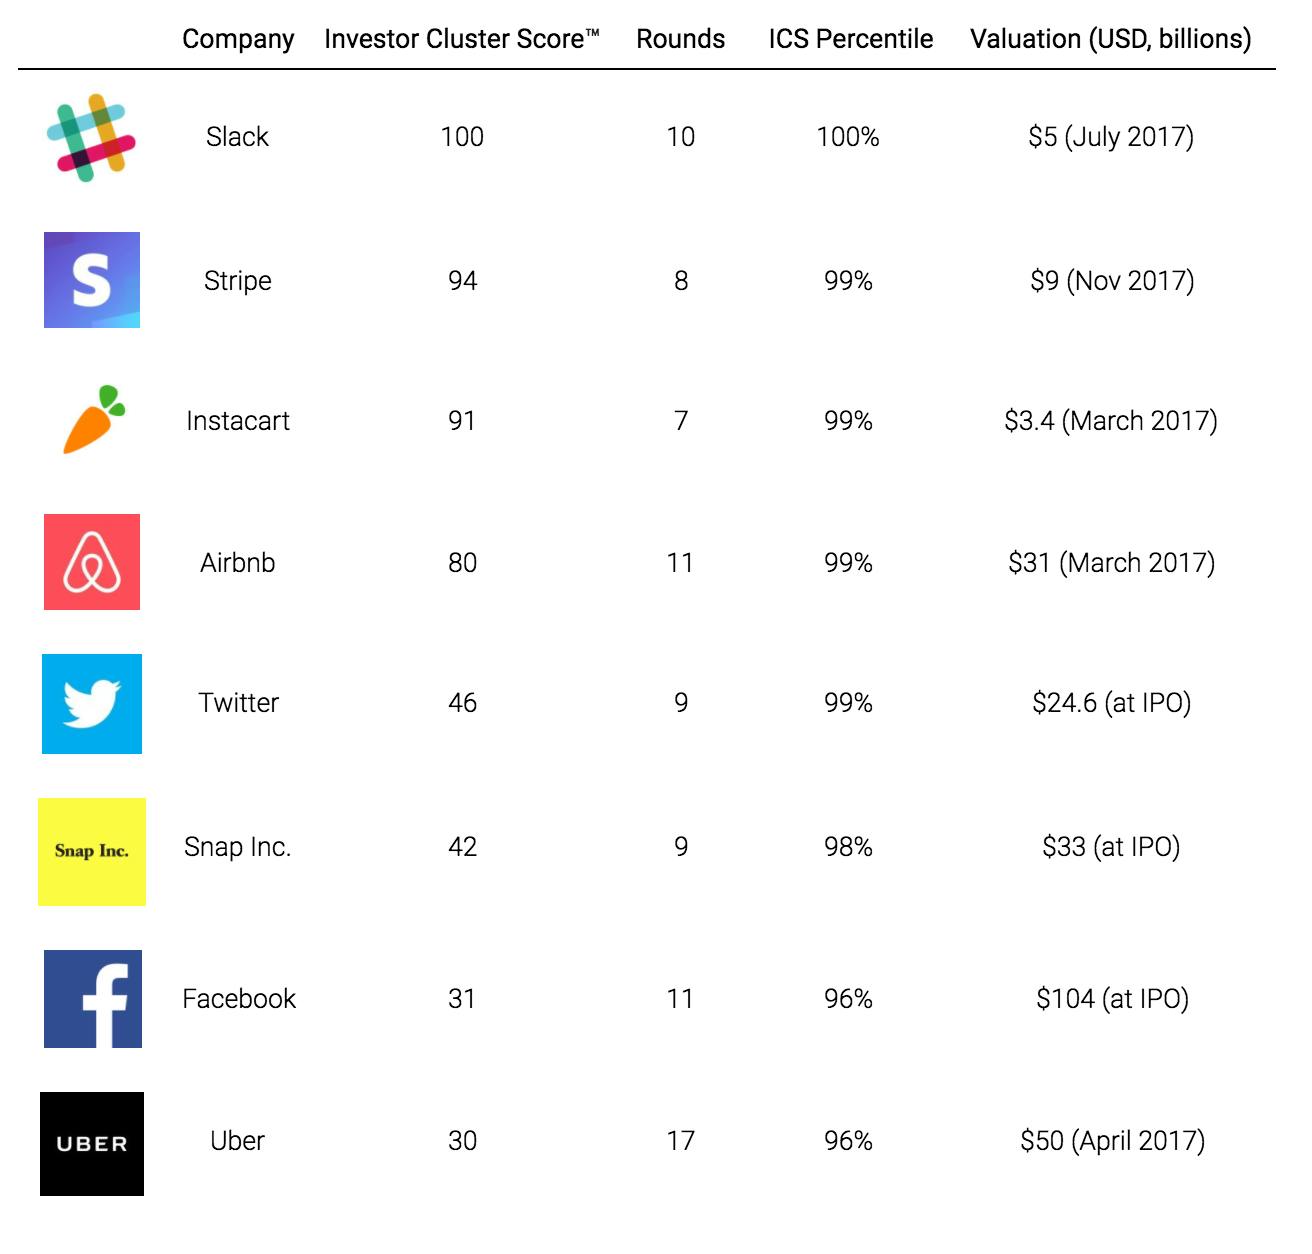
For reporting purposes ICS values are usually normalized to a range from 0 to 100, and as of October, 2017, the average ICS for all startups in our database is 5.1 with a standard deviation of 9.4. Slack has the highest pre-normalized score in history, and is therefore the benchmark by which all other startups are analyzed. Slack’s cap table includes, alphabetically: Accel Partners, Andreessen Horowitz, GGV Capital, GV, Horizons Ventures, Index Ventures, Institutional Venture Partners, Kleiner Perkins Caufield & Byers, Slow Ventures, Social Capital, Spark Capital, SV Angel, and Thrive Capital. Not only that, but most of those big names have followed-on in their investment in the company multiple times. Additional points of reference are included in the table below.
The big takeaway here is that high potential startups tend to have ICS values a few standard deviations above the mean. Interpreting the Investor Cluster Score™ is therefore pretty easy—bigger is better. Pre-normalization the ICS is technically in the set of real numbers between zero and positive infinity. It’s dynamic too. If a VC firm’s fundamental characteristics change, then the corresponding scores for all of their investments are adjusted, though in practice these changes are hardly dramatic. Conducting analytical inference with the ICS is also straightforward, and generally only involves the additional context of the number of rounds it took for a startup to achieve the score that it has. This is because, as shown in the figure below, ICS values tend to marginally increase as funding rounds increase (OLS Regression,p < 0.001, R-squared = 0.1).
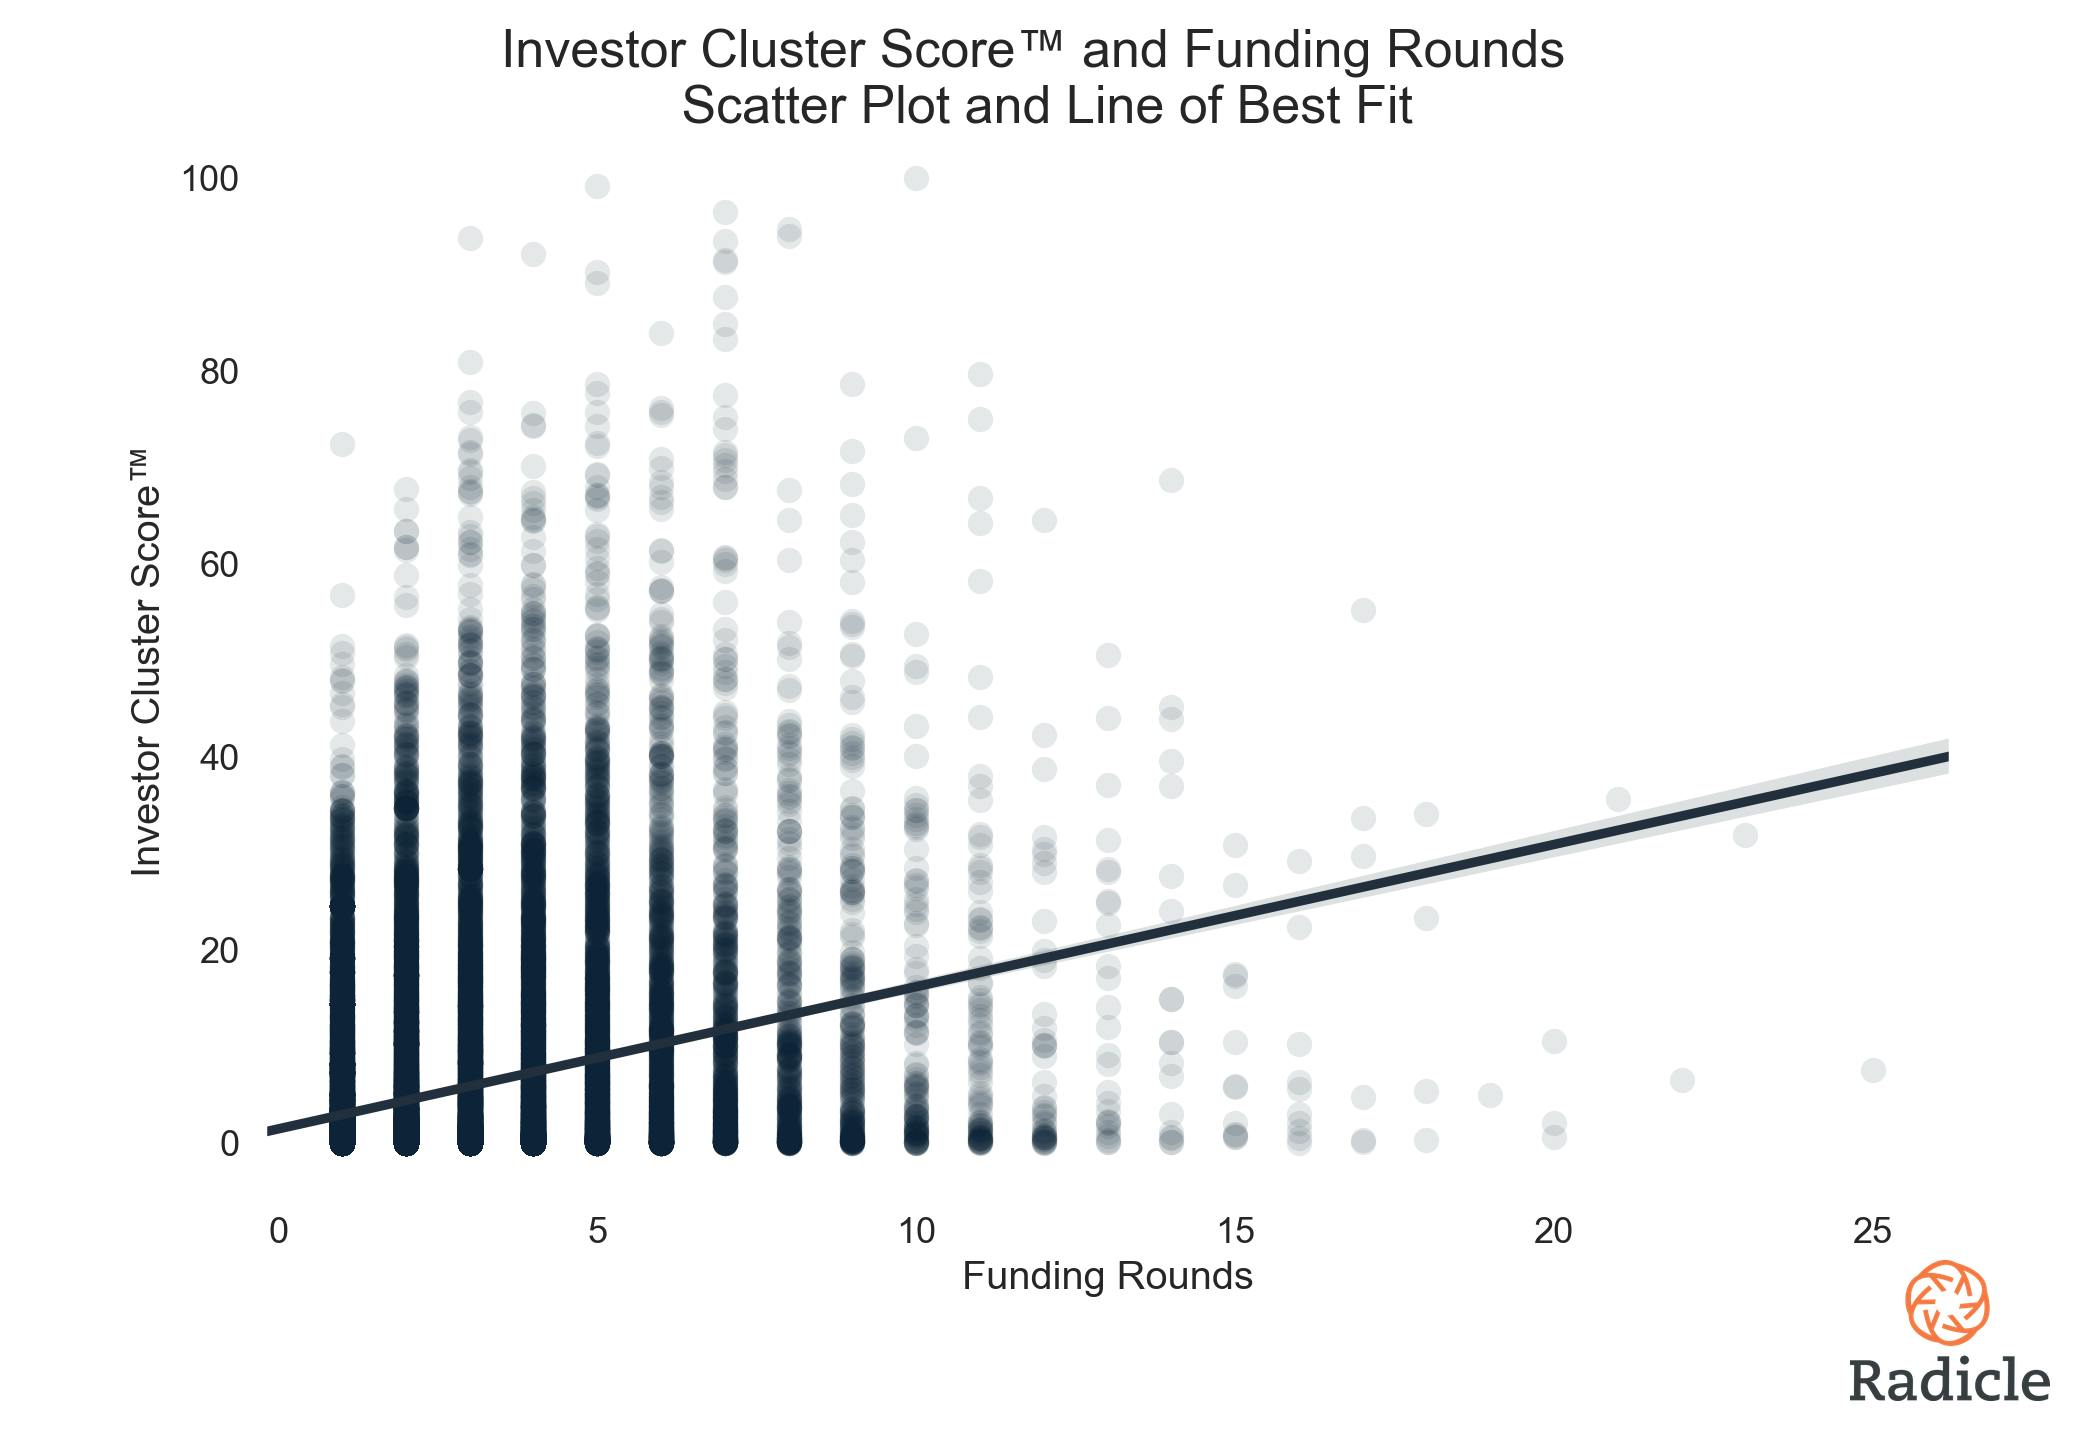
Even though the ICS algorithm controls for total number of financing rounds, this relationship is likely still evident due to two distinct factors: First, prominent venture capital firms tend to coalesce around a startup once it begins to demonstrate high levels of traction, usually after a few rounds of funding. As VC firms seek to optimize their portfolio of startups, they strive to invest in companies that can achieve an exit (and a big one, at that). Since VCs are probably simultaneously looking at very similar growth signals, they likely come to similar conclusions and as a consequence tend to cluster around the few startups that can demonstrate statistically significant deviations from the norm (the norm being failure).
Second, the ICS accounts for every time that a follow-on investment is made by a VC. So, if Andreessen Horowitz invests in a startup twice, Andreessen Horowitz is counted twice. There are clear merits and flaws to this methodological principle. We based that decision on the fact that, broadly speaking, there seems to be a fundamental difference between a startup that convinces its prominent investors to write another check and one that does not (investor biases aside). We believe that this difference is not marginal, and therefore of sufficient importance to justify capturing in our vector space. Others may disagree. Either way, the relationship between ICS and funding rounds is rather weak (R-squared = 0.1) and clearly not deterministic, so while it’s statistically significant and therefore an important factor to consider while conducting analytical inference, it’s not absolutely necessary.
Applying the ICS™ in a Comparative Analytical Framework
While it’s perhaps intellectually interesting to know “from 0 to Slack” how companies are positioned in terms of their capitalization table, we believe the Investor Cluster Score™ is best served in the comparative analytical framework of Radicle’s sector reports. It’s useful when trying to understand how individual startups within a newly disrupted industry are positioned relative to their peers.
For example, Radicle recently covered the newly disrupted renters and homeowners insurance space. By looking at the ICS distribution in this sector, we can immediately understand that Lemonade is leading the pack with an ICS of 46 from four rounds of financing (on par with Twitter).
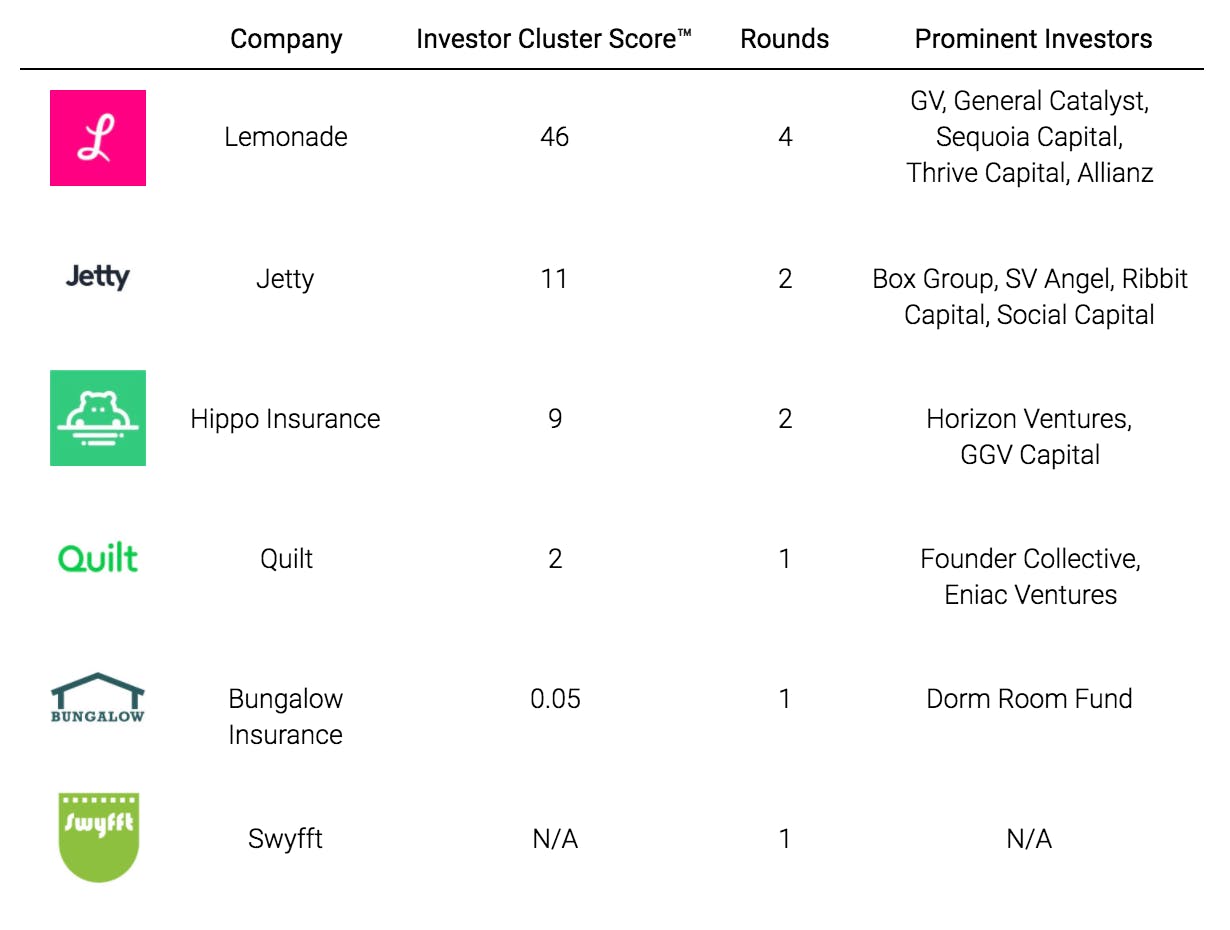
Jetty and Hippo Insurance also produce strong positive signals from their capitalization tables, each with an above average ICS from their second round of institutional financing. Quilt and Bungalow Insurance are less interesting from this perspective, bearing in mind however that a large majority of startups have an ICS of zero. Put that way, an ICS of 2 from one round of financing sounds promising. Swyfft is not given a score since it has not publicly disclosed its source of capital. Our scoring algorithm is ultimately dependent on publicly disclosed data. So, if something is non-disclosed, sadly we won’t know about it–nor will anyone else–and that’s okay.
Concluding Remarks
Oh wait, we forgot about Grammarly! With all of that out of the way, what’s Grammarly’s Investor Cluster Score™?
It turns out that having General Catalyst, Institutional Venture Partners (IVP), and Spark Capital in their first round of institutional capital gives Grammarly an ICS of 20.5, which is over 1.5 standard deviations above the mean—suggesting that they are indeed taking their business to the next level. This is no longer a qualitative judgement, but rather a quantifiable fact.
By quantifying the signal from every startup’s capitalization table, the ICS helps us better understand and evaluate companies in disruptive environments, and opens up the possibility of thinking about startup competition in a new light.