A few weeks ago in an article titled “How much runway should you target between financing rounds?”, we discovered that the conventional wisdom of targeting 12–18 months of runway between financing events could be a factor that leads to startup failure. We’re delighted with the positive response to that piece (thanks for the shout-out Crunchbase!), and we sincerely hope it helps entrepreneurs make more informed decisions when assessing their cash runway.
The results of that analysis further sparked our curiosity around startup failure, which is often generalized to be nine out of ten. If we consider that statistic for a moment — it implies that a startup always has a 90 percent likelihood of failure. Without even diving into probability theory and statistical philosophy, I just don’t think that’s actually true. Your startup’s likelihood of success should evolve as your specific circumstances change.
We explore this general idea by assessing the startup failure rate from a sequential point of view, which allows us to evaluate whether a startup’s likelihood of failure is static or changes based on how far along it has progressed in the venture capital funnel.
Analytical Framework
We look at startup failure from two distinct lenses — (1) failure to raise the next sequential round of capital, and (2) failure to exit. For the former, we identify companies that raised a k round and failed to raise the following k+1 round. In layman’s terms, that means we segment by all companies that successfully raised a Seed round but failed to raise a Series A. Then we take all companies that raised a Series A but failed to raise a Series B — independent of whether or not they had previously raised a Seed stage round, or ever skipped a step and raised a round of capital classified as a Series C— and so on — until the Series G stage. For the latter, we identify the companies that raised a k round and ultimately failed to exit via an IPO or acquisition.
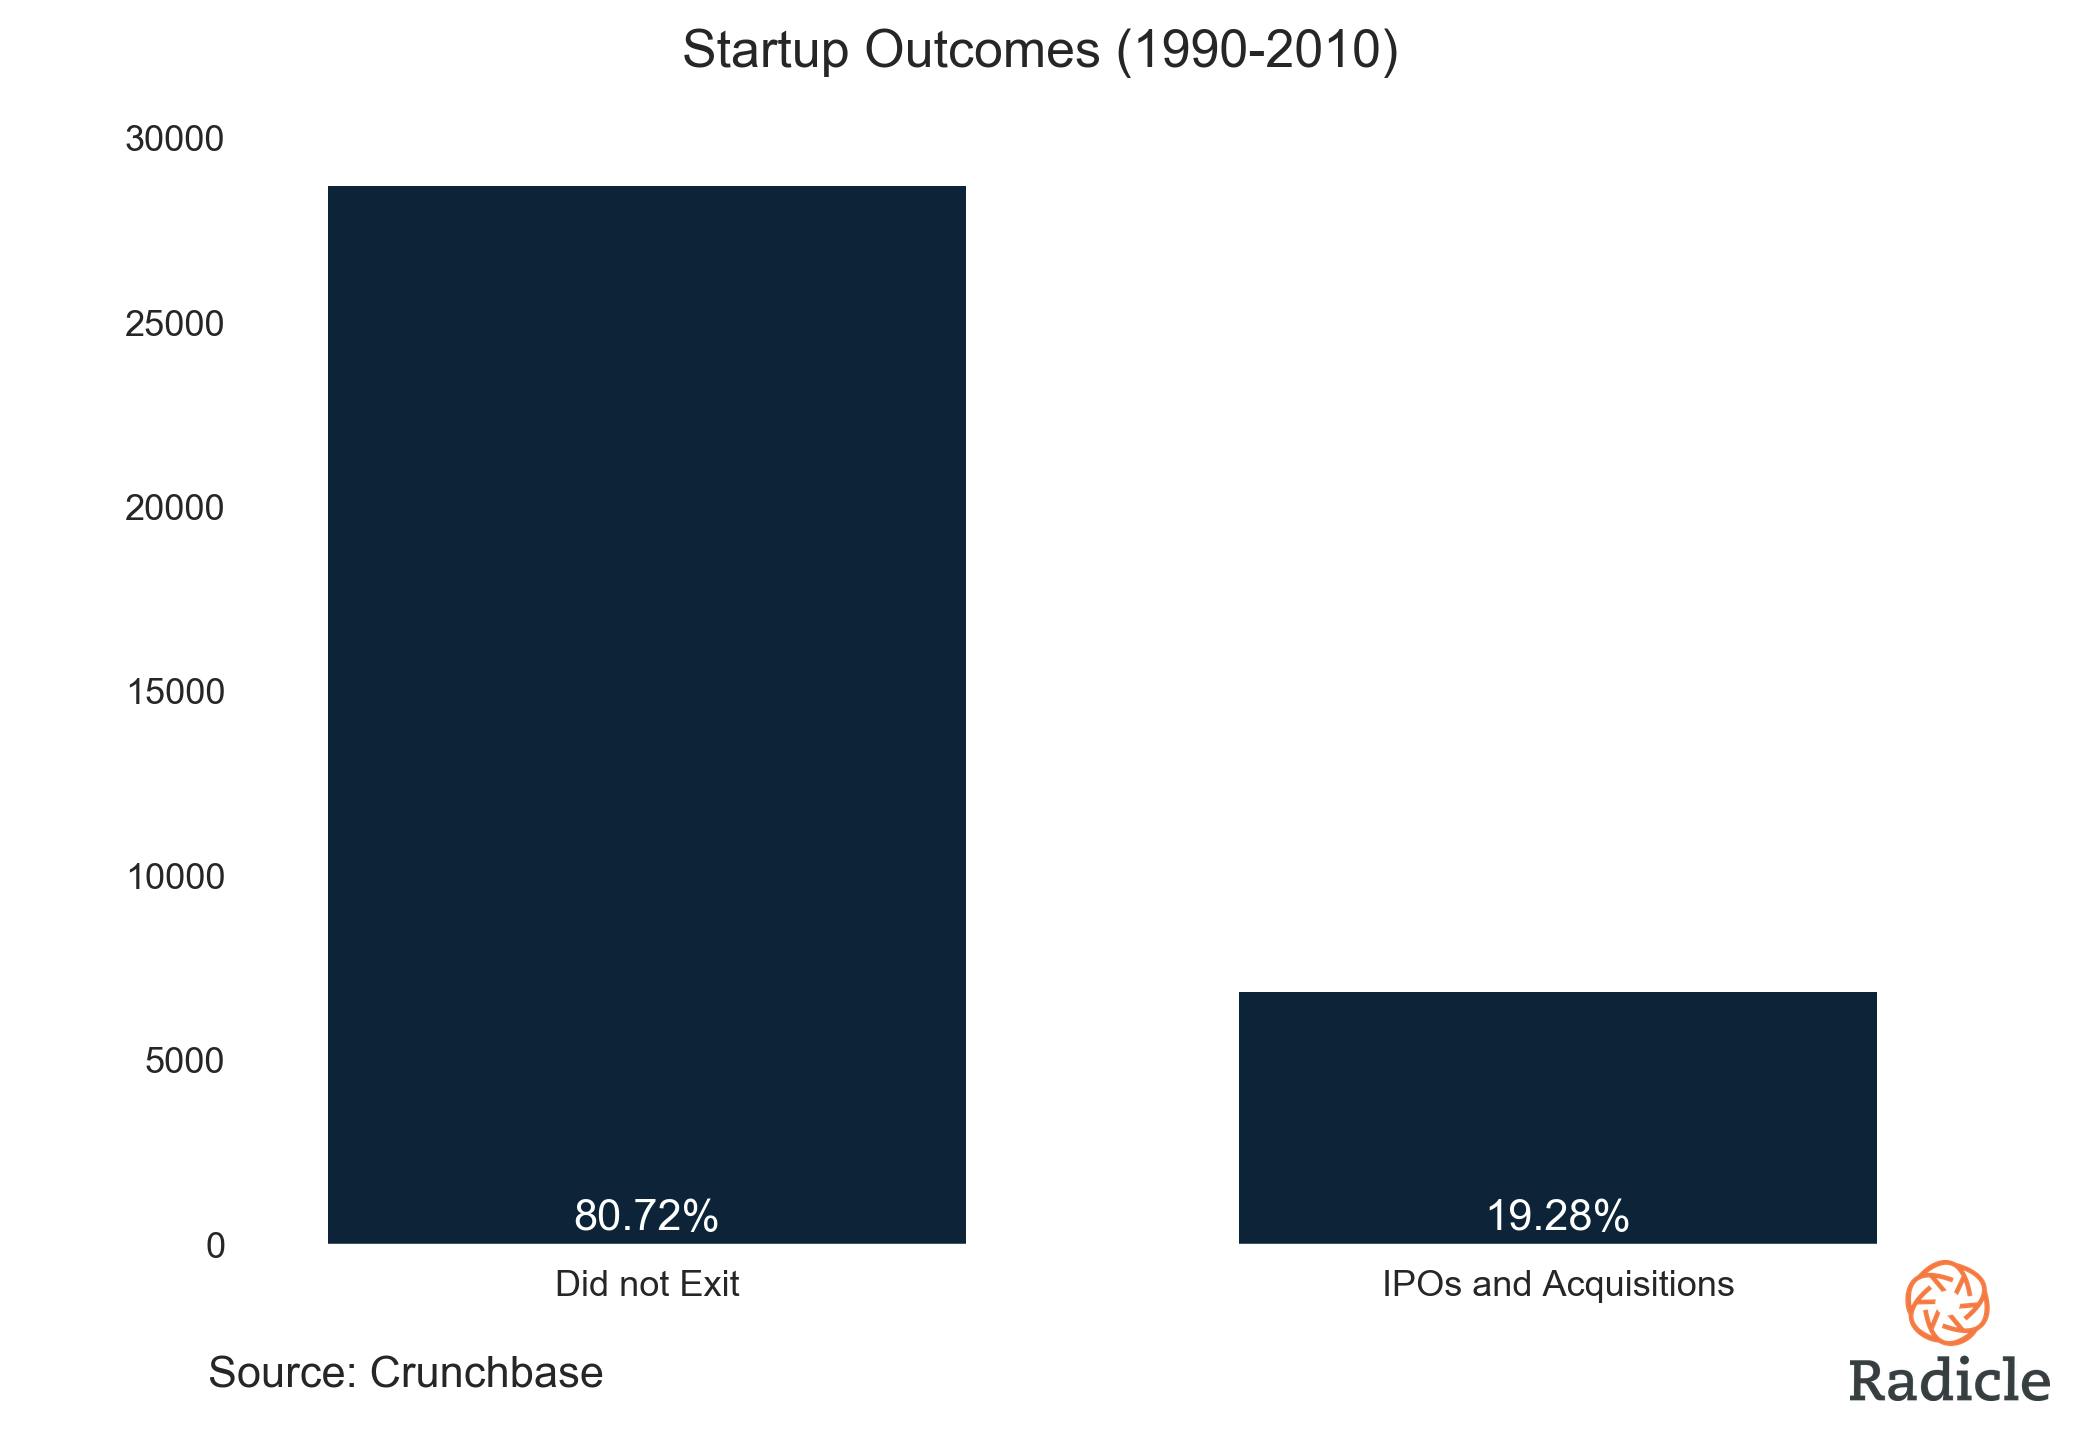
A potential pitfall of this type of analysis is Survivor Bias — where only companies that are successful are accounted for — which is ultimately a question of data quality. In this analysis, we’re dealing with the opposite type of imbalance, however, since our sample consists primarily of startups that failed in the venture capital sense (did not exit). This data imbalance is a more accurate representation of reality. Our sample consists of 35,568 startups founded between 1990 and 2010. Of those, 6,856 eventually achieved an IPO or acquisition.
So what does the data say?
Not surprisingly, the rate of failure to exit decreases as a startup progresses through financing stages. This is an intuitive result—you would expect a company that is further along in the sequence to be more mature and established, and hence more likely to exit. Even so, it’s rather nice to see that intuition backed by data.
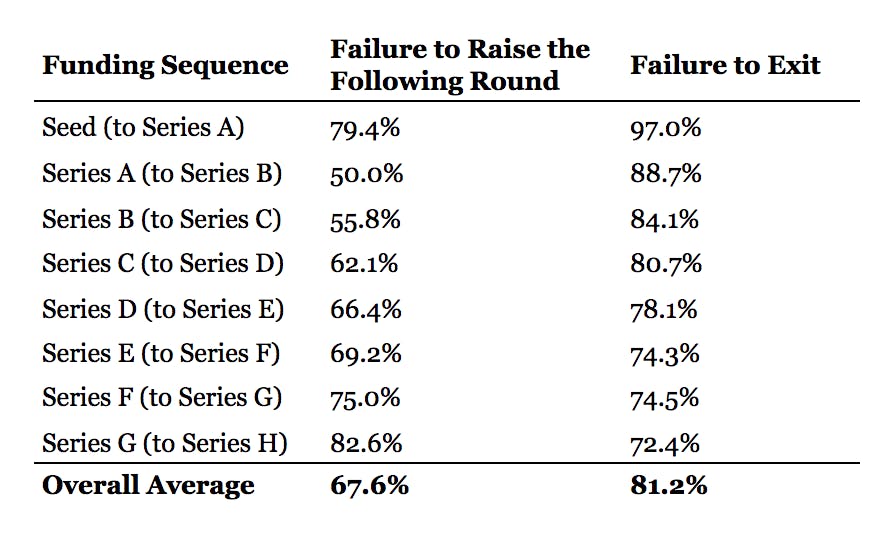
The rate of failure to raise the following round makes for a significantly more interesting analysis. Notice the considerable drop from Seed (79.4%) to Series A (50.0%), and directional reversal to Series B (55.8%) — resulting in a kink in the line plot below. It suggests that going from Seed to Series A is remarkably difficult, but if you’ve managed to raise a Series A then your odds of raising a Series B are one in two. Once you’ve raised that Series B however, it again becomes more difficult to raise a Series C — and so on — until the lines intersect at Series F.
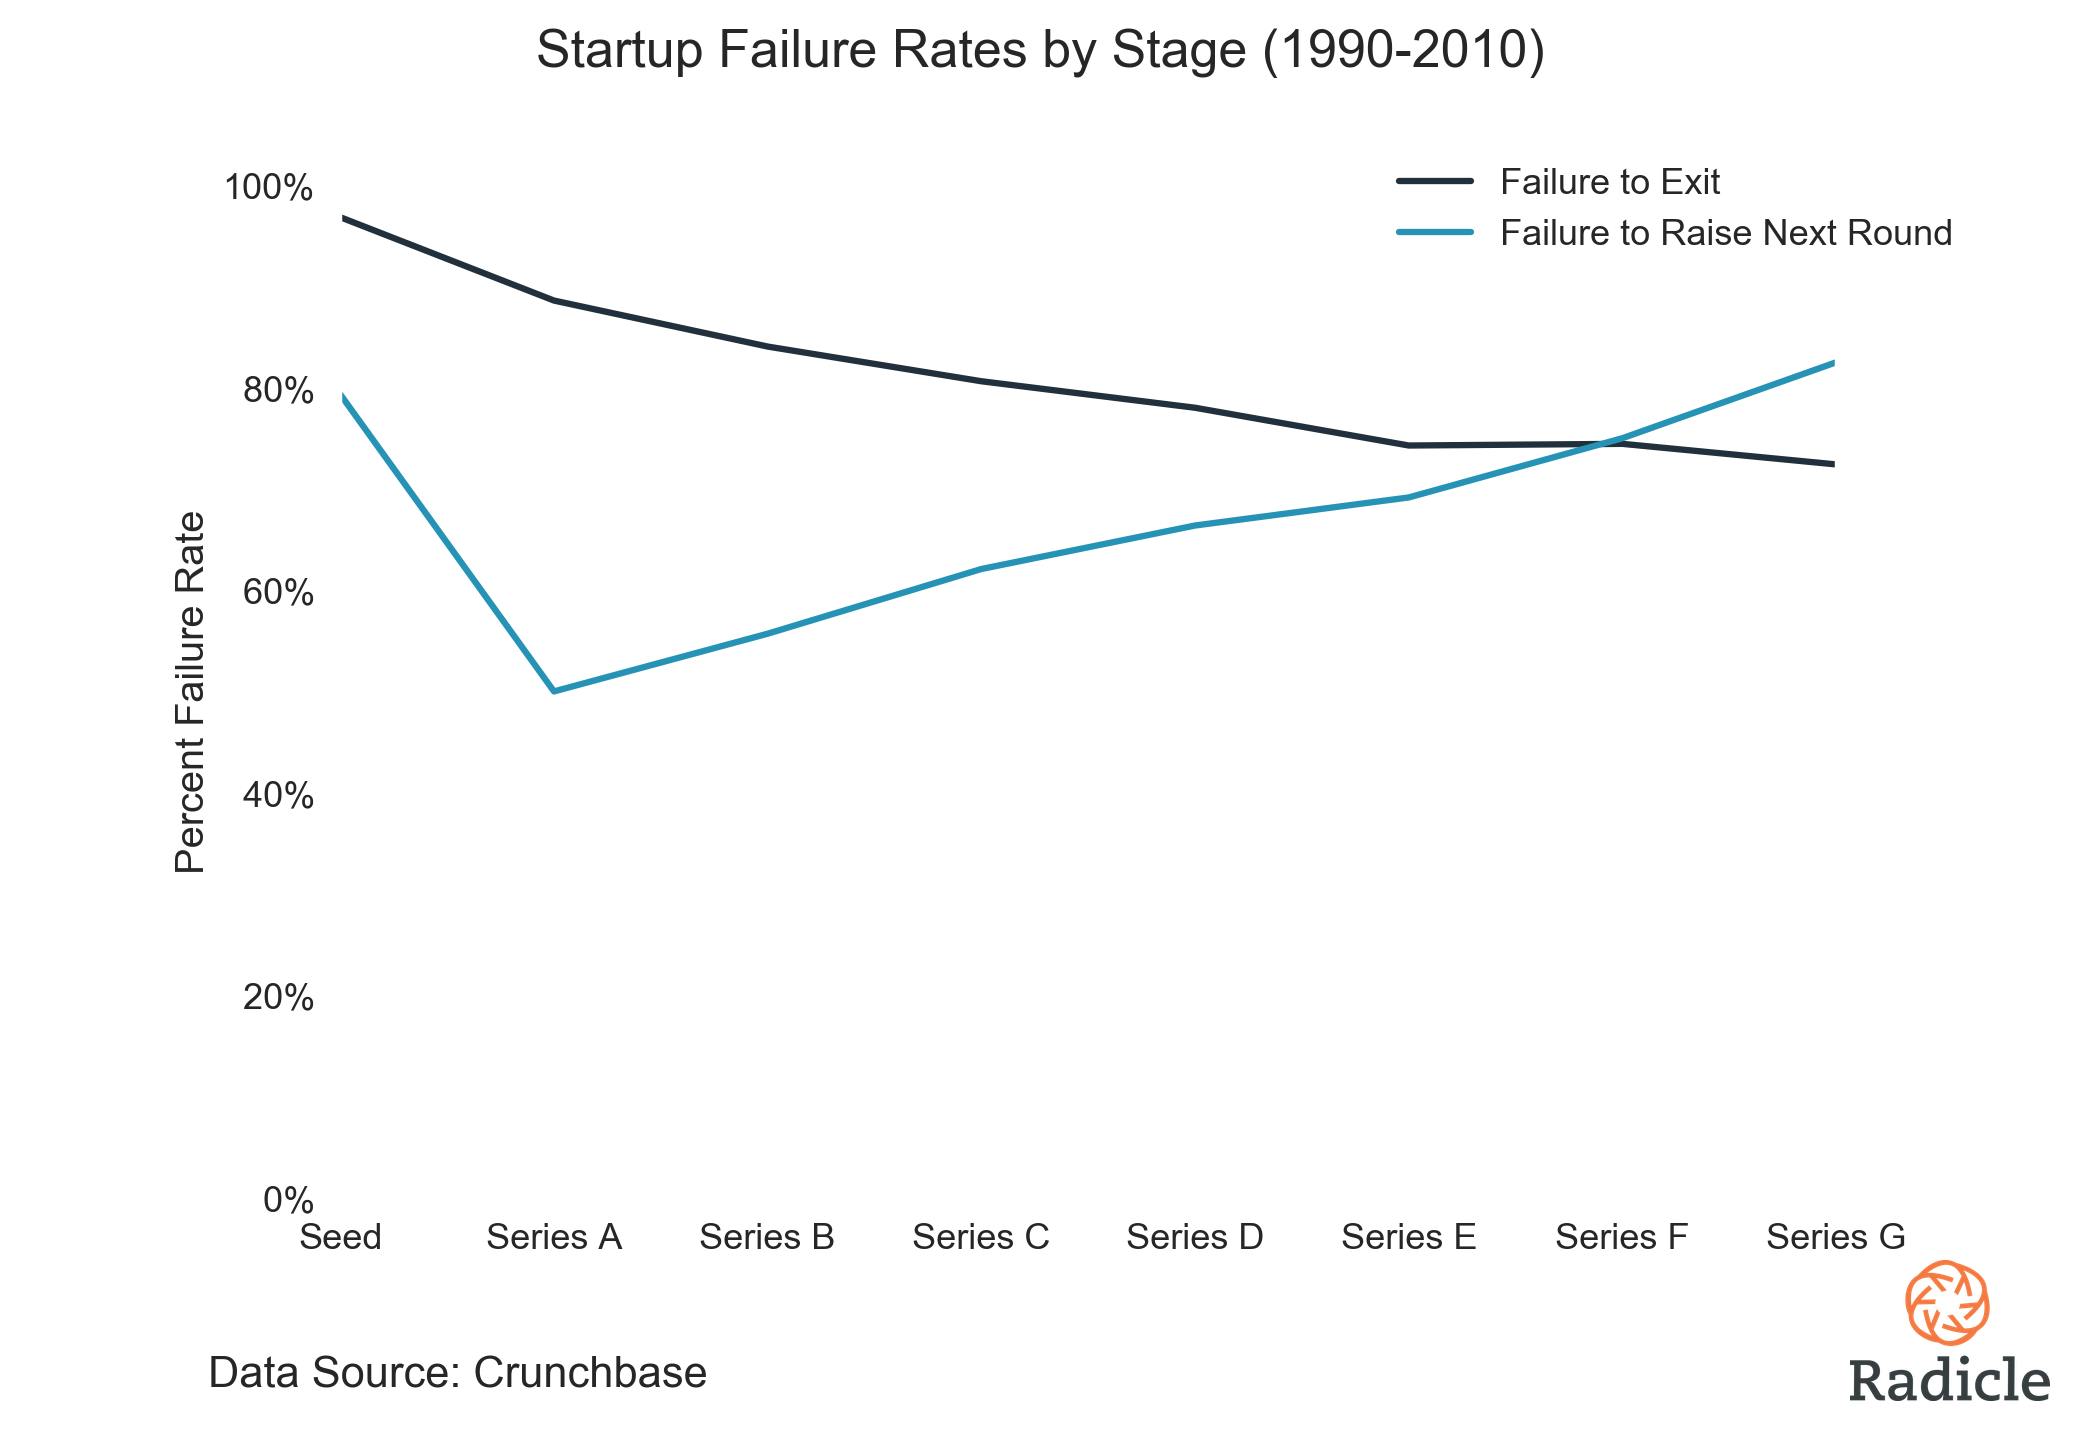
The intersecting lines tell us that a Series F startup is as likely to exit as it is to raise a Series G. One step further and the story changes, however, as a company that raises a Series G is more likely to exit than it is to raise another round of institutional capital. This suggests that after a certain point, it’s more likely to be acquired than it is to convince a group of VCs to inject further capital in your company (the lines don’t intersect until much later when segmenting by companies that have IPO’d). Intuitively this makes sense. After a certain point, we would expect a successful company to be able to sustain itself, close if it can't, or exit if it’s in a strong position.
So no, you’re not always facing a 90% likelihood of failure. By the time your company has reached the Series G stage your likelihood of failure to exit has dropped to ~74%, all other things being equal (ceteris paribus for the econometricians in the audience). Put another way, your likelihood of success has increased to ~26% from just ~3% at the Seed stage. Granted, that’s not much, but hey! It all helps.
The further along you are, the more likely you are to succeed. Keep pressing.